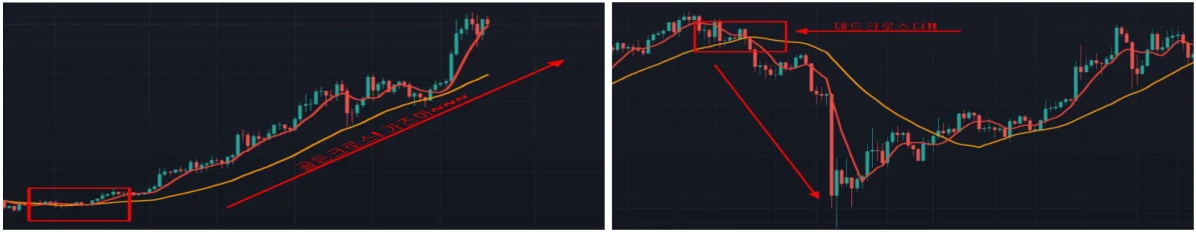
이동평균선 크로스 분석
● 크로스 분석(골든 크로스, 데드 크로스) 1.크로스 분석은 당기 이평선이 장기 이평선을 아래에서 위로 상향 돌파하는 골든 크로스…
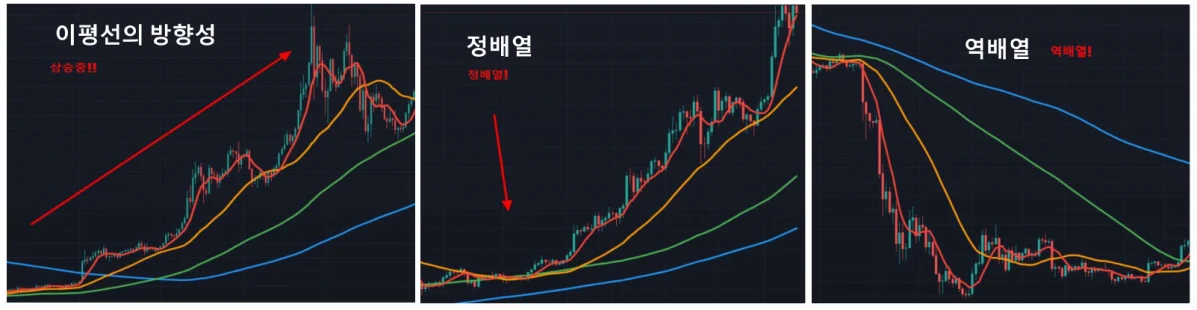
이동평균선 활용하여 분석 방법
이동 평균선을 활용하여 분석 방법*사진*(빨간색 기준 5일, 20일, 60일, 120일 순 이평선) ● 방향성 분석 1.방향성 분석은 각…

이동평균선
● 이동평균선 이란? 이동 평균선은 기술적 지표 중 가장 다양하고 많이 사용되고 있는 지표다. 가격의 변동성을 일정기간 동안…
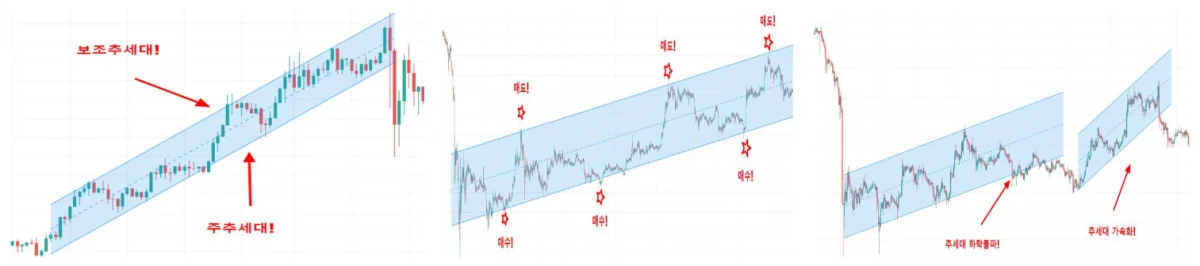
추세대
추세대는 가격 움직 임이 추세선을 따라 일정한 가격 안에서 움직일 때 그려지는 선입니다. 이는 가격 의 등락이 일정한…
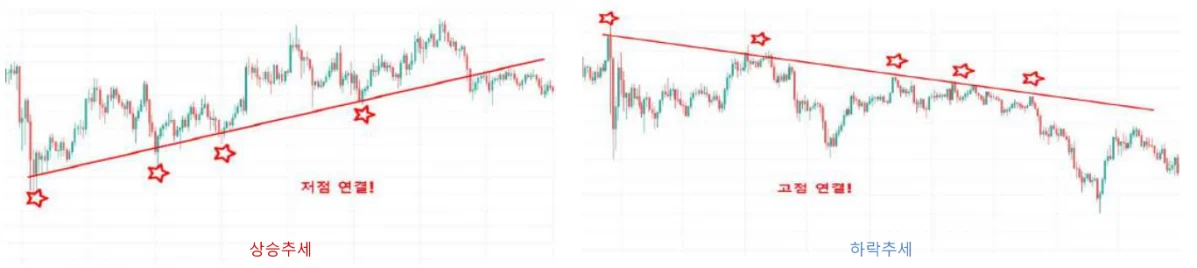
추세선
● 추세선 1.추세선은 추세를 분석하기 위해 사용되고 있는 기법이다. 2.추세선은 오래 지속되고 시도된 횟수가 많을수록 중요하다. 3.추세선은 상승…
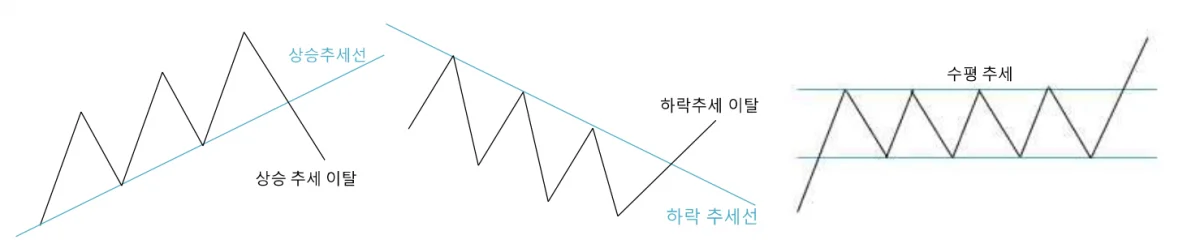
추세
● 추세는 크게 3가지 방향이 있다. (상승, 하락, 횡보) 1.상승 추세는 고점과 저점이 점차 상승 하는 것을 말한다….
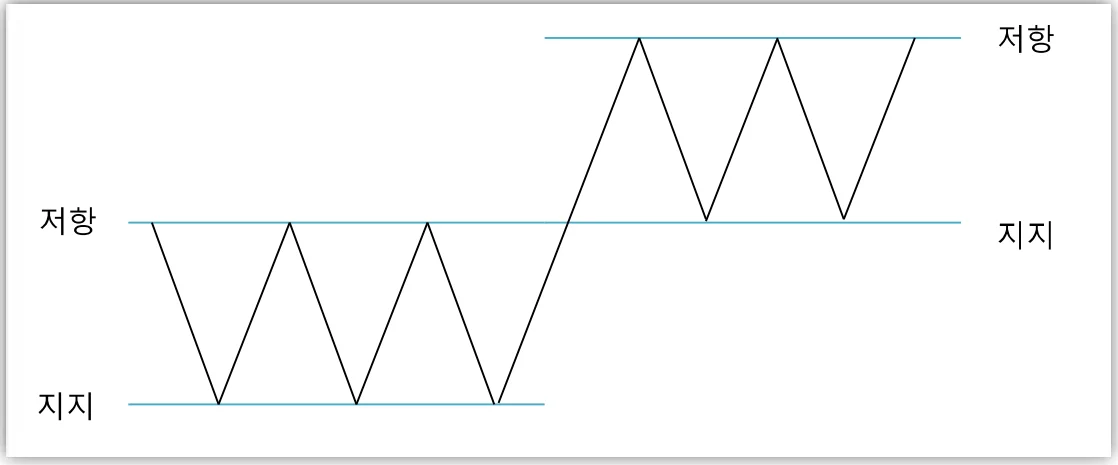
지지와 저항
● 지지와 저항 1.지지와 저항은 시장을 구분하지 않고 사람의 심리를 반영하는 요소다. 2.가격이 어느 일정한 수준까지 상승한 후…
기술적 분석 또는 이론
1. 기술적 분석에 대한 시장 흐름 2. 가격은 추세에 따라 움직인다. 3. 역사는 반복된다. 4. 기술적 분석의 유용성