Analysis method using moving averages
Analysis method using moving average line Photo (Red 5-day, 20-day, 60-day, 120-day net moving average line)
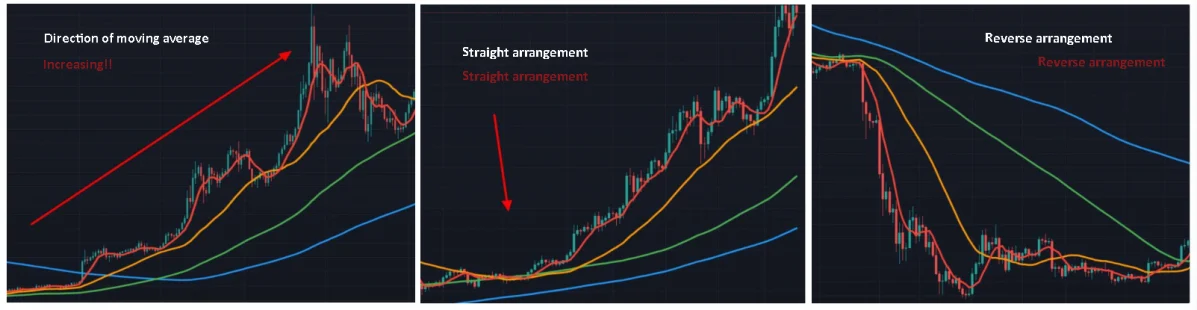
● Directional analysis
1.Directional analysis is a method of analyzing whether each moving average is rising or falling.
2.The upward trend changes in the order of 5th, 20th, 60th, and 120th days, and even in a down market, the decline begins in the order of the short-term and medium-term moving averages.
● Sequence diagram analysis
1.It is widely used to analyze normal and inverse arrangement states.
2.A positive arrangement refers to a state in which current prices are arranged from top to bottom in the order of short-term, medium-term, and long-term moving averages, and an inverted arrangement refers to the opposite case.
3.If the arrangement is reversed, the trend is often downward. In the case of regular arrangement, it is often possible to follow a long-term trend.
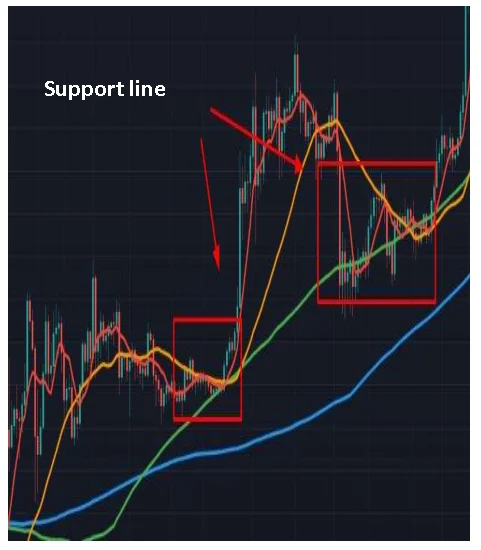
● Support analysis
1.When the price is rising, the short-term, mid-term, and long-term moving averages rise as support, but when the price reverses downward, it deviates downward from the moving averages one by one.
2.Based on this, it can be used to identify the characteristics of short-term, mid-term, and long-term moving averages, prevent temporary deception (ant dusting), and increase returns.
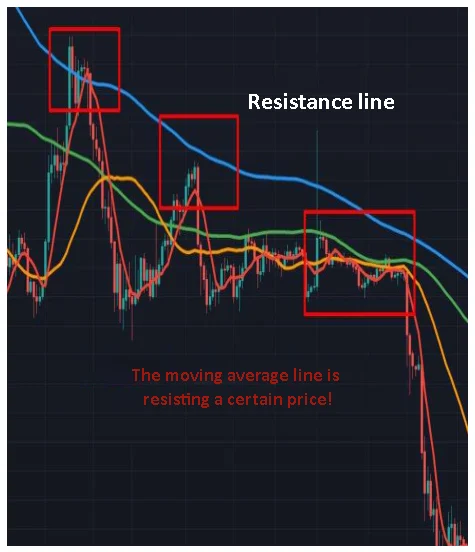
● Resistance line analysis
When the price is falling, the short-term, mid-term, and long-term moving averages become resistance lines one after another, and when the price falls or reverses upward, the price rises as each moving average is broken upward in turn.