Analyzing Market Forces through Trading Volume
Entry, Accumulation, and Distribution of Market Forces through Trading Volume
Entry
1.Market forces are naturally interested in stocks that they can lift and move the price of.
2.They have little interest in top-tier stocks that they can’t dare to challenge.
3.Stocks that have been sitting at the bottom for a long time, have little public interest, but are good candidates for generating future news are ideal.
4.Market forces may enter slowly over a long period without leaving any traces, or if they enter in the short term, they will create candlesticks with long upper wicks on the chart and form accumulation candles.
5.Accumulation candles typically pierce the upper band of the Bollinger Bands.
Accumulation
1.Once entered, market forces will accumulate based on short, medium, or long-term scales, managing the 20-day moving average during this process.
2.They keep the price in a prolonged sideways movement or let it slowly decline to shake off retail investors who entered at the same stage.
3.Retail investors with weak mental fortitude or lack of experience cannot withstand this process and will eventually sell off.
4.Bollinger Bands will contract and trading volume will be low.
5.Market forces set up thick sell walls and pick up shares sold by retail investors who entered during the long upper wicks, managing the 20-day moving average to prevent it from turning downwards while continuing to accumulate.
6.These movements are hard for retail investors to endure, leading them to eventually sell off their shares.
Distribution
1.After sufficient accumulation, market forces will start spreading good news and set up fake buy walls to pump up the stock price.
2.Retail investors will rush in, seeing the positive news and soaring large green candlesticks.
3.When the price reaches the target, market forces offload their shares to retail investors and exit, leading to a long-term downtrend, like water flowing from a broken bucket.
Example Chart
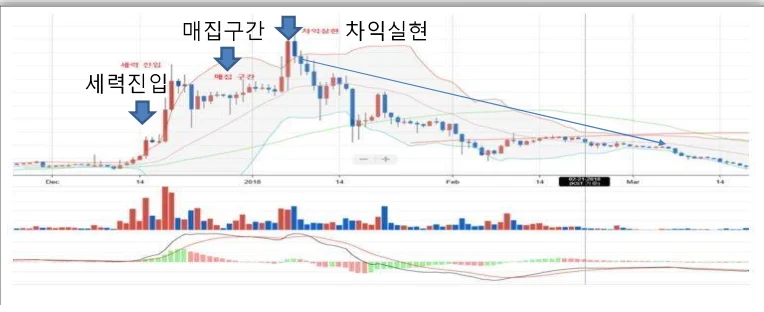
1.The right photo shows the chart of Quantum from 2018.
2.It shows entry with shots that have long upper wicks and pierced the upper Bollinger Band, followed by accumulation. During this time, trading volume on red candles was not significant.
3.After pumping, trading volume surged on red candles with long upper wicks, indicating a high probability of a wash sale.
4.You can see the market forces realizing profits and then exiting.