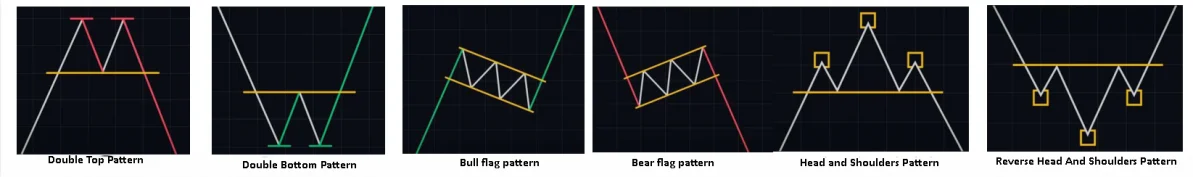
1.A double top is a bearish reversal pattern where the price reasches a high point twice but fails…
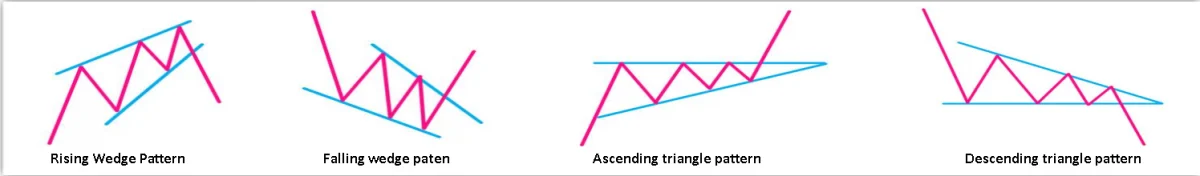
● Rising Wedge Pattern 1.The Rising Wedge pattern is a downward trend pattern. 2.This means that as the…
1.The basic idea of pattern analysis is that the past repeats itself. 2.Pattern analysis is a collection of…
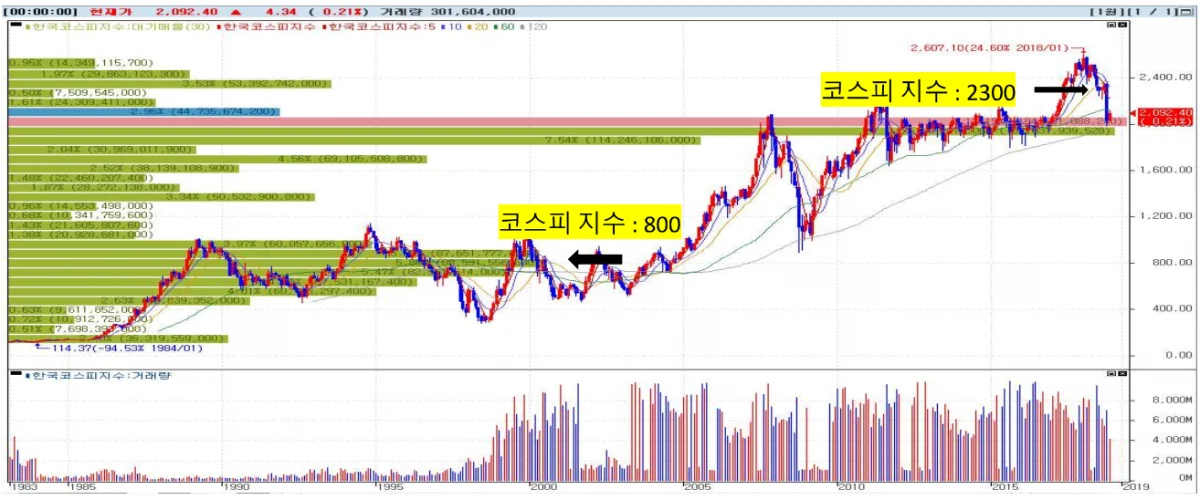
● Example of KOSPI Resistance and Support Zone ● How to Set Up a Resistance and Support Zone…
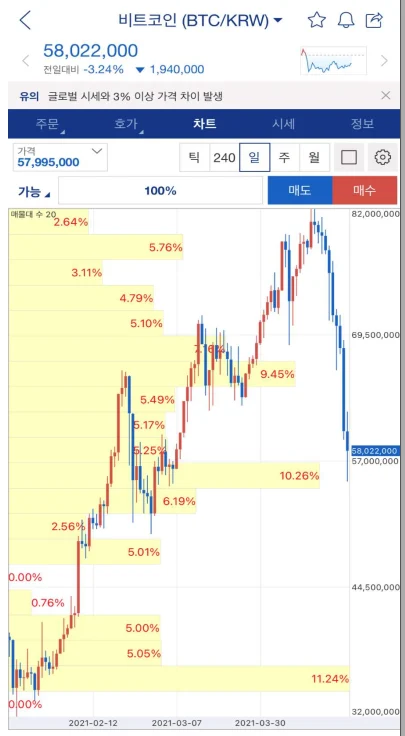
1.The primary reason for analyzing and using charts in trading is not to predict the future but to…
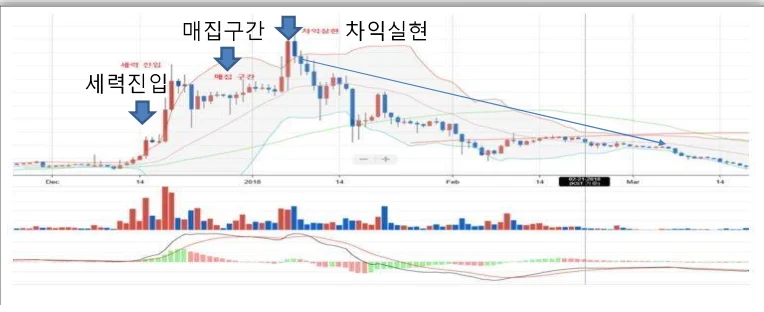
Entry, Accumulation, and Distribution of Market Forces through Trading Volume Entry 1.Market forces are naturally interested in stocks…
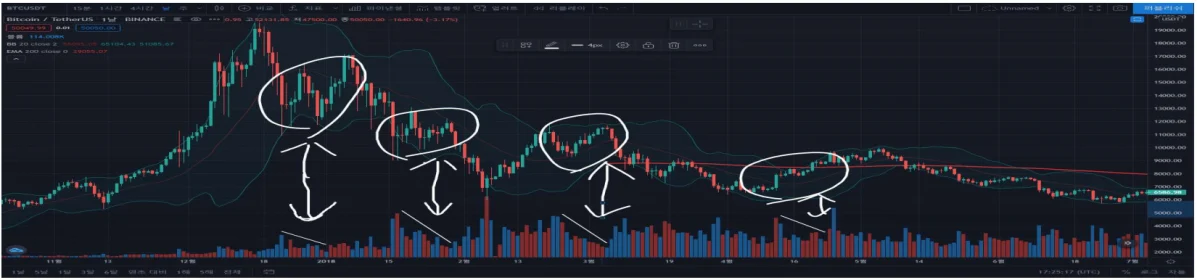
Don’t be happy about a rise without trading volume, and don’t be sad about a decline with no…
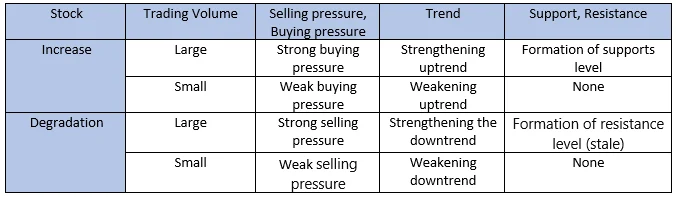
Buying Pressure and Selling Pressure 1.When we look at the market trends, we should not only see whether…
1.There are many different chart analysis methods and too few secondary indicators. No one sees all of this….
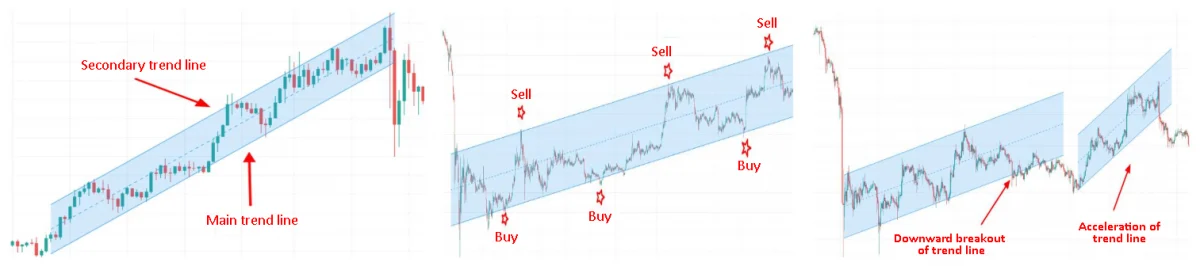
A trend zone is a line drawn when price movement moves within a certain price along a trend…
- 1
- 2