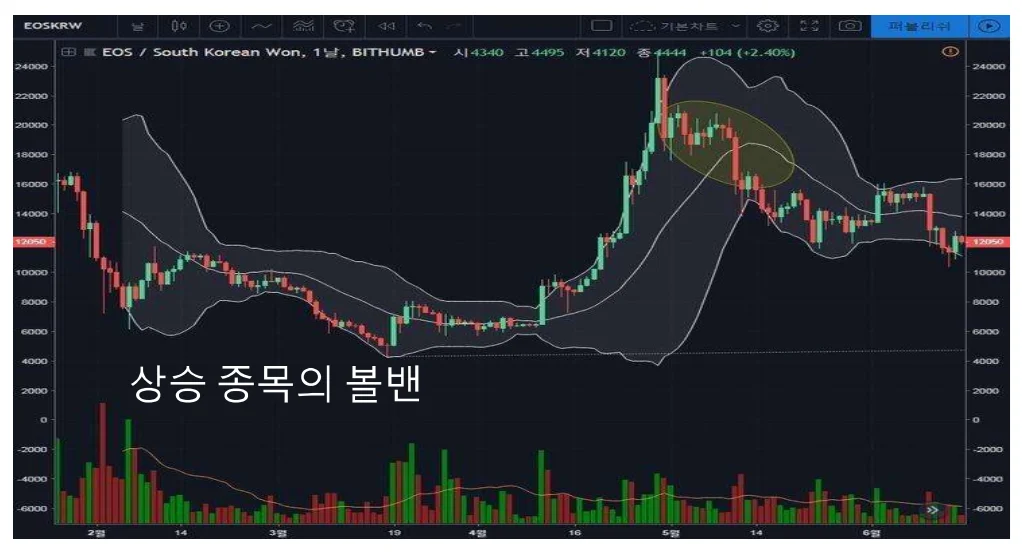
● Bollinger Bands for Rising Stocks 1.The rise can be divided into two cases: a sharp rise by…

● Trading box notes using Bollinger Bands 1.The first thing I will talk about when using Bollinger Bands…

In orther to understand the properties of Bollinger Bands, it is best to first understand the characteristics of…
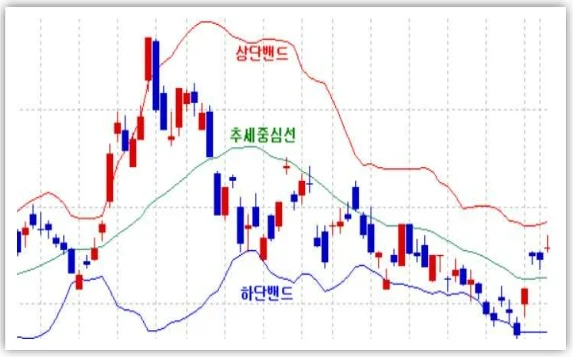
● Bollinger Band 1.Bollinger Bands are a stock technical analysis toll developed by John Bollinger in the 1980…
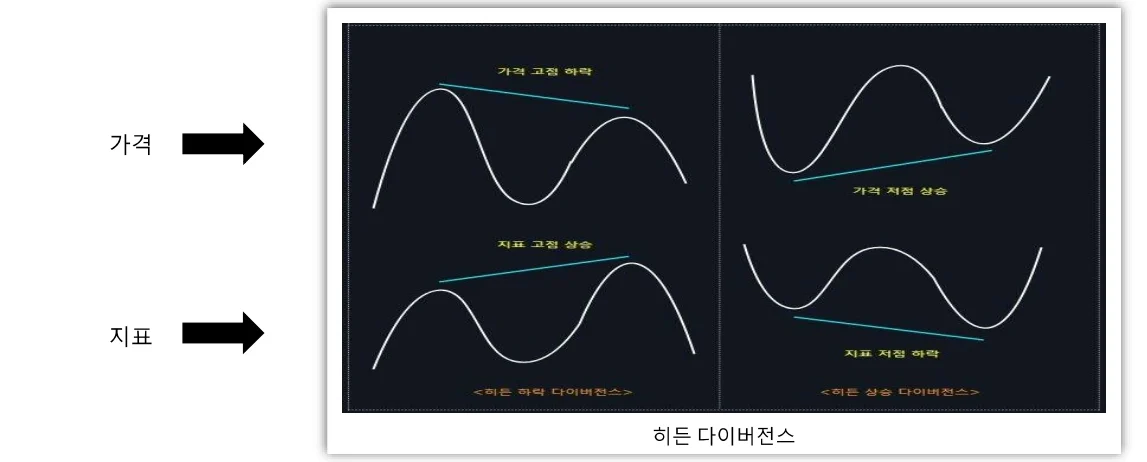
1.Hidden divergence often appear after regular divergences appear. 2.In this case, it is kwon that hidden divergence is…
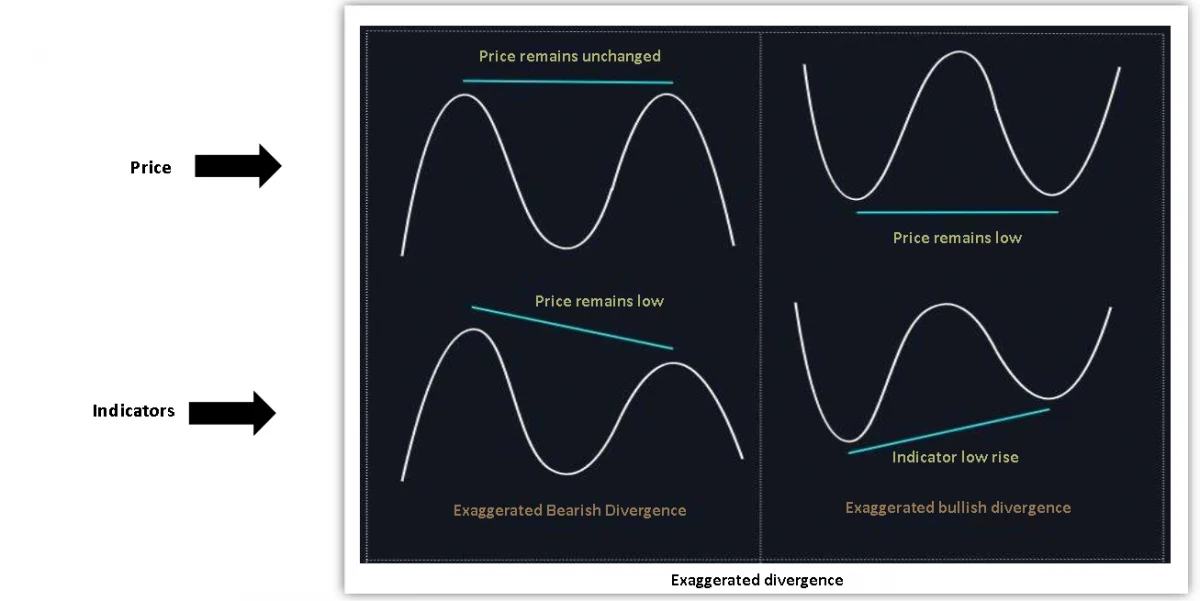
1.Exaggerated divergence is similar to general divergence, and personally, I think it can be viewed as a type…
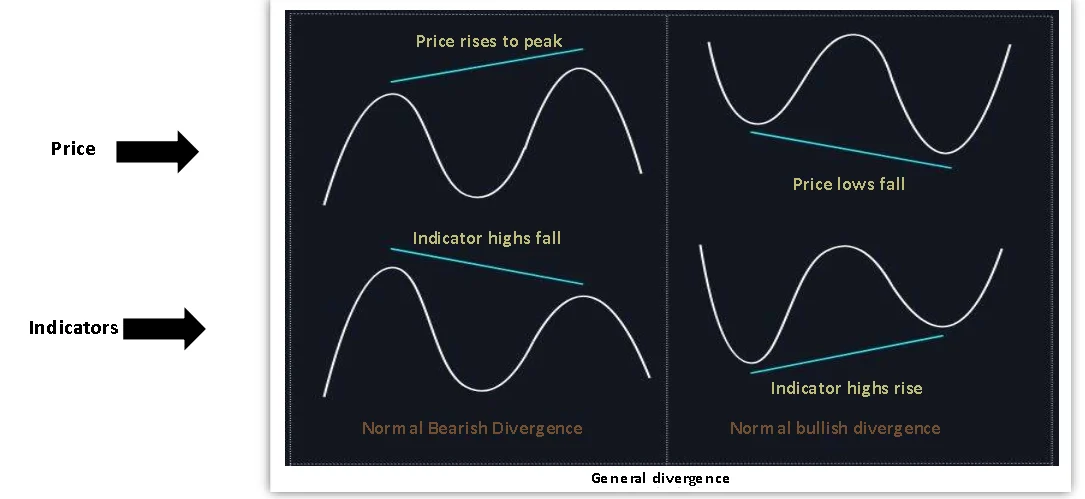
1.A general downward divergence is said to have occurred when the high point od the price rises, but…
1.What all technical analysts most desire is to make trades by knowing in advance that a downtrend or…
Understanding Divergence 1.One of the most useful things when using secondary indicators is divergance. 2.Divergance can be seen…
What is Indicator Analysis? ● Indicator analysis is a method of analyzing market conditions to predict market movements….
- 1
- 2