Definition and characteristics of Bollinger Bands
● Bollinger Band
1.Bollinger Bands are a stock technical analysis toll developed by John Bollinger in the 1980 and acquired as a trademark in 2011.
2.Bollinger Bands, relative indicators and bandwidth developed in Trading Bands are used to determine the high and low price relative to previous transactions.
3.Bollinger Bands are a volatility indicator similar to the Keltner Channel.
4.Bollinger Bands were developed on the premise that stock prices move within the standard deviation range around the moving average line.
5.Bollinger Bands are in indicator used to predict futures stock price by diagramming past stock price trends into bands.
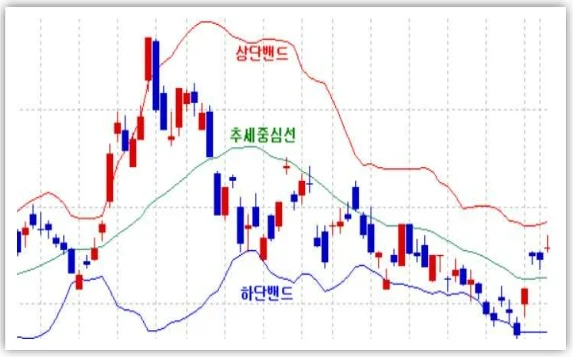
6.Bollinger Bands are in a band format, with the 20 moving average at the center and upper and lower band above and below.
7.The stock price is located between the upper and lower bands, and through this, trading methods can be used.
● Composition
1.Bollinger Band is a moving average (MA) for N periods.
2.Upper band K times standard deviation above moving average
3.K times standard deviation lower band below the moving average
Typically the values of N and K are 20 and 2. the default choice of average is a simple moving average, but other types of averages can be used as needed. Exponential moving averages(EMA) are a common alternative.
Usually, the same period is used for the calculation of the median band and standard deviation.
● Purpose of Bollinger Bands
1.The purpose of Bollinger Bands is to be an indicator that provides definitions for judging relative high and low prices.
2.By definition, stock prices are considered high in the upper band and low in the lower band.
In other words, the closer it gets to the top of the Bollinger Band, the more likely it is that stock prices will fall, and conversely, the closer it gets to the bottom of the Bollinger Band, the more likely it is that stock prices will rise again.
You can create a trading strategy using these Bollinger Bands.