Double Top Pattern
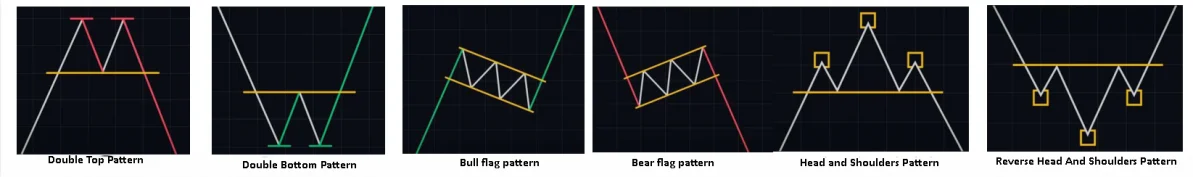
1.A double top is a bearish reversal pattern where the price reasches a high point twice but fails to break higher on the second attempt.
2.The price decline between the two highs should be moderate.
3.The double top pattern is confirmed when the price falls below the low point between the two highs.
Double Bottom Pattern
1.A double bottom is a bullish reversal pattern where the price reaches a low point twice and breaks higher on the second attempt.
2.Similar to the double top, the price movement between the two lows should be moderate.
3.This pattern is confirmed when the price rises above the high point between the two lows.
Flag Pattern(Bull Flag, Bear Flag Pattern)
1.A flag is a consolidation pattern that appears after a sharp price movement, characterized by a brief period of sideways movement that resembles a flag on a flagpole. The flagpole is the sharp price movement, and the flag is the consolidation phase.
2.Flag are used to judge the continuation of the prevailing trend. The accompanying trading volume is also important. Ideally, the sharp movement should be accompanied by high volume, while the consolidation phase should have lower and decreasing volume.
3.A bull flag pattern occurs in an uptrend, following a sharp price rise, a slight decline, and sideways movement before typically continuing the uptrend.
4.A bear flag pattern occurs in the downtrend, following a sharp price decline, a slight rise, and sideways movement before typically continuing the downtrend.
Head and shouders pattern
1.The head and shoulders is a bearish reversal pattern charaterized by three peaks, with the middle peak(head) being higher than the two side peaks(shouders), and a baseline(neckline) connecting the lowest points of the two troughs.
2.The side peaks should be approximately at the same price level, white the middle peak should be higher.
3.The pattern is confimed when the price falls below the neckline.
Inverse Heas and Shoulders Pattern
1.This is the opposite of the head and shoulders pattern, indicating a bullish reversal.
2.The inverse head and shoulder forms during a downtrend, with the price making a lower low followed by a recorey to a level similar to the first low, creating a support lovel.
3.The pattern is confirmed when the price rises above the neckline resistance.