Example of Resistance and Support Zone
● Example of KOSPI Resistance and Support Zone
● How to Set Up a Resistance and Support Zone
To set up a resistance and support zone on TradingView, you need to set it to Visible Range.
For reference, you need to use the chart either with a 30-day free trial or by paying for it.
On Upbit, this feature has been removed from PC and is now only available on the phone.
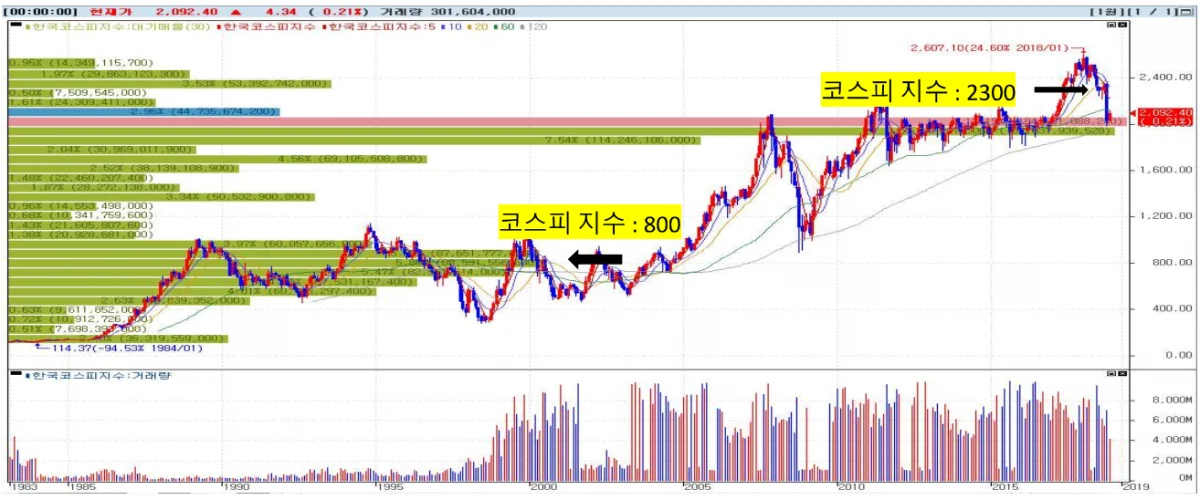
1.The above picture shows the KOSPI 2018 chart with monthly candles and resistance/support zones.
2.The KOSPI index dropped vertically after breaking below 2300, and is currently showing signs of a rebound in this area.
3.The KOSPI index built a thick resistance and support zone between 1900 (long green bar) ~ 2100 (long red bar) from the early 2010s over five years.
4.In the picture, the index fell due to strong selling pressure and downward momentum, but is now rebounding after encountering a thick resistance and support zone.
5.The 1900 ~ 2100 range is a thick resistance zone and support area, making it difficult to break below it.
6.It is hard to predict whether it will break below this zone in the future or continue a rally with a strong rebound. However, if you understand the concept of resistance and support zones, you can see that this is a strong support area where a rebound can be expected.
7.If this zone breaks down, there is a gap below with the next thick resistance zone between 800 ~ 1000.
8.This information can help you determine that this would be an area to consider cutting losses if it breaks down further.
9.It also suggests that it will take time to absorb the buying pressure generated in the current resistance and support zone before moving downwards, a conclusion that can be drawn from understanding resistance and support zones.