General Pattern
1.The basic idea of pattern analysis is that the past repeats itself.
2.Pattern analysis is a collection of price flow patterns that occur repeatedly in past charts.
3.Because the content is easy, many people know it, and pattern analysis is something that many people talk about.
4.However, this pattern analysis can also be toxic if used without knowing what each pattern means, where the pattern is completed, and where trading volume should explode.
5.One of the mistakes people make is to assume that they will draw a similar shape and buy it because they say they are drawing a similar shape when the pattern is not completed in the pattern analysis.
6.In order to avoid making these mistakes, you must understand that patterns are not simply made up of the shape of a candle but also contain meaning, and you must know well what point to set as the buying point.
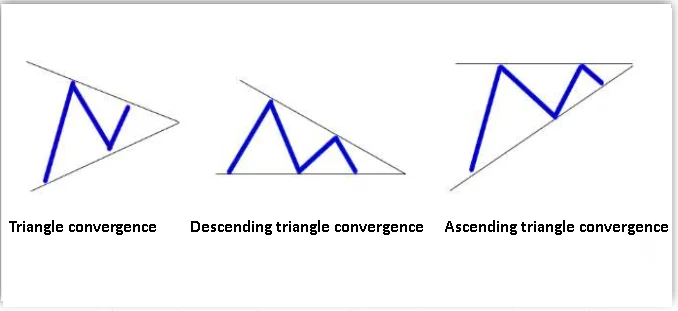
● Triangle convergence
-The triangle convergence pattern is a pattern in which prices converge to a certain point as price volatility decreases.
-The drawing method is based on the upper part of the downward trend and the lower part of the upward trend.
-Basically, convergence patterns generally result in a decrease in trading volume.
There are three types of generally known triangular convergence patterns.
1.Triangle convergence
-In case of triangular convergence, the probability of the stock price moving up or down in case of departure is 5:5.
2.Descending triangle convergence
-In descending triangle convergence, the probability of stock prices moving up and down is 4:6 or 3:7.
3.Ascending triangle convergence
-Ascending triangle convergence has a probability of 6:4 or 7:3 for stock prices to move upward and downward.
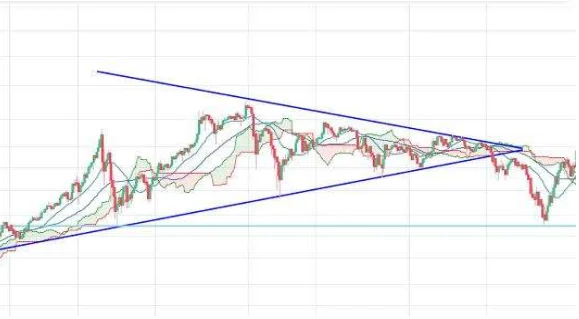
● There are times when you fall into a trap while trading with a triangle convergence pattern.
1.After the triangle convergence, there was an upward breakaway and then trading, but you can see that the stock price is gradually coming down from the top of the trend line.
2.This is expressed as a trap or whipsaw.
3.The triangle convergence pattern must be traded when it breaks upward.
4.If the stock price falls, it may fall significantly. And after an upward breakout, we need to set a stop loss price.
5.Just because there is a deviation from the triangle convergence upward trend does not necessarily mean that the stock price will rise.
6.In order to avoid falling into the trap, you must set a stop loss price based on a certain standard.