MACD definition and meaning 1
1.MACD is one of the representative trend indicators. It is an indicator that quantifies the degree of convergence and divergence between the short-term moving average and even the increase or decrease in the degree of convergence and divergence by calculating an oscillator that removes the short-term trend.
2.It can be said to be an indicator designed to identify the trend through the chart, go one step further, quantify the strength and slowness of the trend, and recalculate the trend to quickly find out the possibility of a trend reversal when the trend strength slows down.
Mathematical definition
1.First of all, EMA is an exponential moving average, which averages the closing prices for the given date, but is weighted by the most recent day.
2.MACD: The 12-day MACD is usually expressed as a line because it is the difference between the moving averages.
3.It is defined as above, and parameters such as 12, 26, and 9 can be changed and used, but the above values are generally used.
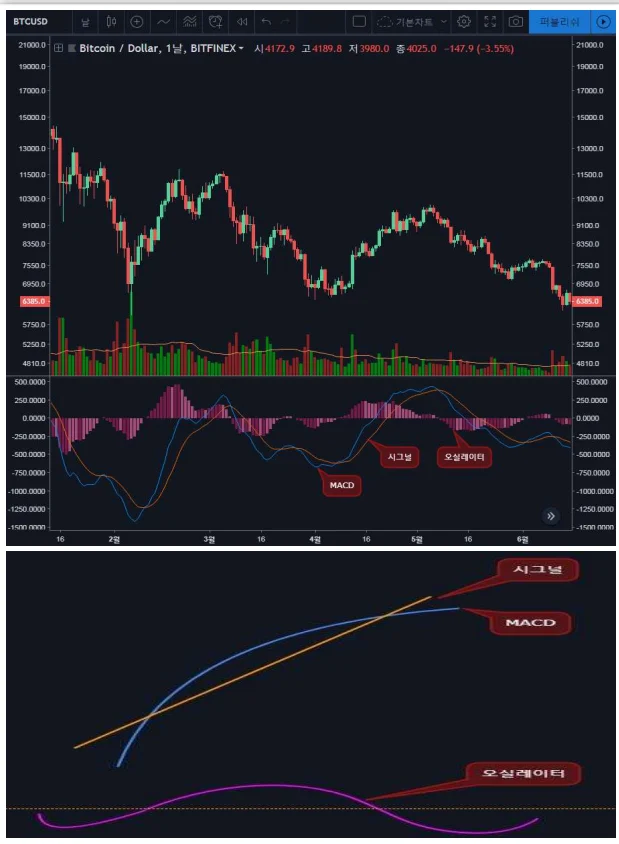
4.As shown in the picture, MACD is usually expressed as a line because it is the difference between the moving averages.
5.The signal is also a moving averages, so it is displayed as a line.
6.However, since the oscillator oscillates(oscillates) near 0 as the difference between the MACD and the signal, it is usually expressed as a histogram.
Standard definition
1.MACD is the value obtained by subtracting the long-term moving average from the short-term moving average and indicates the degree of convergence and divergence of the short-term and long-term moving averages.
2.The short-term and long-term moving averages repeat convergence and divergence, and when divergence occurs, the absolute value of MACD will increase, and if it converges, it will converge to a value close to 0. Therefore, MACD will rise and fall based on 0.
3.As the short-term moving average breaks upward from the long-term moving average and the uptrend becomes stronger, MACD will become positive, and as the short-term moving average breaks above the long-term moving average and the downtrend becomes stronger, the absolute value will become negative.
4.MACD itself alone can show the degree of convergence and divergence of the short- and long-term moving averages, but by calculating the oscillator minus the signal, the trend change in the degree of convergence and divergence is calculated.
5.In other words, by removing MACD’s short-term average and short-term trend signals from MACD, the oscillator indicates the trend strength of the short-term and long-term separation of stock prices.
6.In other words, when the oscillator breaks and decreases, it does not mean that the short- and long-term separation decreases, but rather that the separation increases (MACD increases) but the increasing trend slows down.