Moving average density analysis
Density analysis
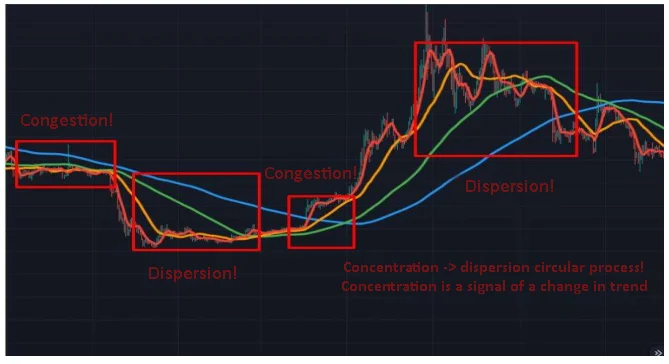
1.This is a method of analyzing long-term, medium-term, and short-term moving averages through the process of cycle of rise and fall as they are separated from each other, density, and concentration or dispersion.
2.As the moving average distance becomes farther apart, the existing trend continues, and when the moving price begins to narrow, it signals that a trend reversal is approaching.
Trend trading method
1.Downtrend trading strategy
● If the short-term moving average rapidly breaks below the short-term moving average from top to bottom, it is a sell signal.
● If the prices of the long-term line, medium-term line, short-term line, and short-term line are reversed in order from above and are falling side by side, there is a high possibility that the bearish market will continue.
● After the reverse arrangement of the short-term, medium-term, and long-term moving averages continues for a considerable period of time, when the short-term moving averages can no longer fall and begin to rise, this is the point at which a bottom is expected.
2.Investment strategy in an upward trend
● If the short-term moving average rapidly breaks above the main long-term moving average from bottom to top, it is a buy signal.
● From above, if the prices are arranged in the order of short-term, mid-term, and long-term and are rising in parallel, it is in an upward phase.
● After the short-term, medium-term, and long-term moving averages remain aligned for a considerable period of time, when the short-term moving averages no longer reach and weaken, a short-term high is expected.
● When the short-term, medium-term, and long-term moving averages are crowded together and confusingly intertwined, the direction of the market is unclear, so it is better to delay the purchase timing by one step.