Trend line
● Trend line
1.Trend line is a technique used to analyze trends.
2.The longer a trend line lasts and the more times it is tried, the more important it is.
3.Trend lines are divided into upward trend lines and downward trend lines, and are subdivided into short-term, medium-term, and long-term trend lines depending on the time range.
● Trend line method
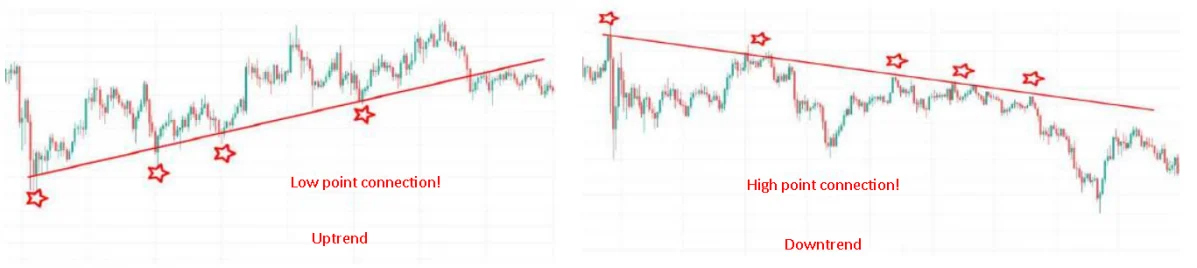
1.Uptrend: The trend line tells the point of change in the trend in determining the low and high points.
2.Downtrend: The downtrend line can be used as a resistance area for selling purposes.
3.As long as the trend line is not broken, this can be used to determine buy and sell areas.
4.A breakout of the trend line is one of the earliest warnings that the trend is changing.
5.Trend Breakout: When drawing a trend line, it should not only connect the closing price of the day, but must include both the lowest and highest points of the day, including all market price movements during the day.
● How to draw a trend line
1.It is important to draw the trend line accurately.
2.In any trend, there must be evidence for it.
3.An upward trend requires two or more low points, and a downward trend requires two or more high points.
4.When drawing an upward trend, draw a line from the first low point to the second or higher low points.
5.When drawing a downward trend, draw a line from the first high point to the second or higher high point.
● How to determine trend changes
1.If the closing price breaks through the trend line, there is a high possibility that the trend has changed.
2.If the price deviates from the trend line by more than a certain percentage, it can be viewed as a trend reversal.
3.If the trend line breaks through after a certain period of time, it can be viewed as a trend reversal.
4.If the price is trading above the breakout line for 1-2 weeks after the breakout, it can be seen as a trend reversal.