Trend zone
A trend zone is a line drawn when price movement moves within a certain price along a trend line.
This is a technical tool used to determine whether price fluctuations are formed within a certain channel (range).
● How to use trend zone
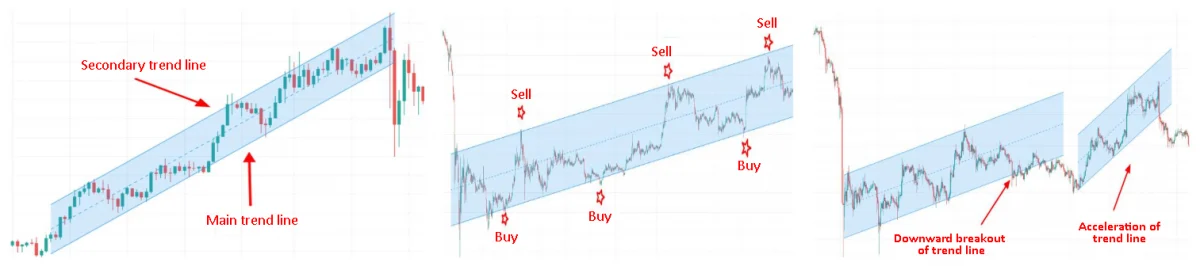
1.When a trend occurs, it is highly likely that the market price movement will repeat fluctuations between the two trend lines rather than breaking through the main and secondary trend lines formed above and below.
2.Regardless of whether the trend is upward or downward, it can be used to buy when the price approaches the main trend line formed below, and sell when the price approaches the secondary trend line formed upward.
3.The importance of trends is that they can be appropriately used in such short-term trading and it is easy to observe price and trend movements as a whole.
4.Even if a trend is formed and the price movement occurs between the upper and lower trend lines, it will eventually break through the trend zone.
5.Breaking through the upper line of an uptrend zone can be seen as strengthening the trend and a new trend, and breaking through the secondary trend line can be seen as a change in trend.
*Caution*
To draw a trend zone, you need at least 2 high points and 2 low points. This means that it may be too late to enter the actual transaction. In addition, even if the downtrend breaks through, it is not always a reversal of the trend, and you may see cases where it rises more sharply after a short-term rebound.
As a trend band analysis tool, you can also see cases where the trend rises more rapidly after an overall rebound.
As a trend band analysis tool, it is good to understand the overall impact and trade by looking at other indicators in detail.