Use of Bollinger Bands 2
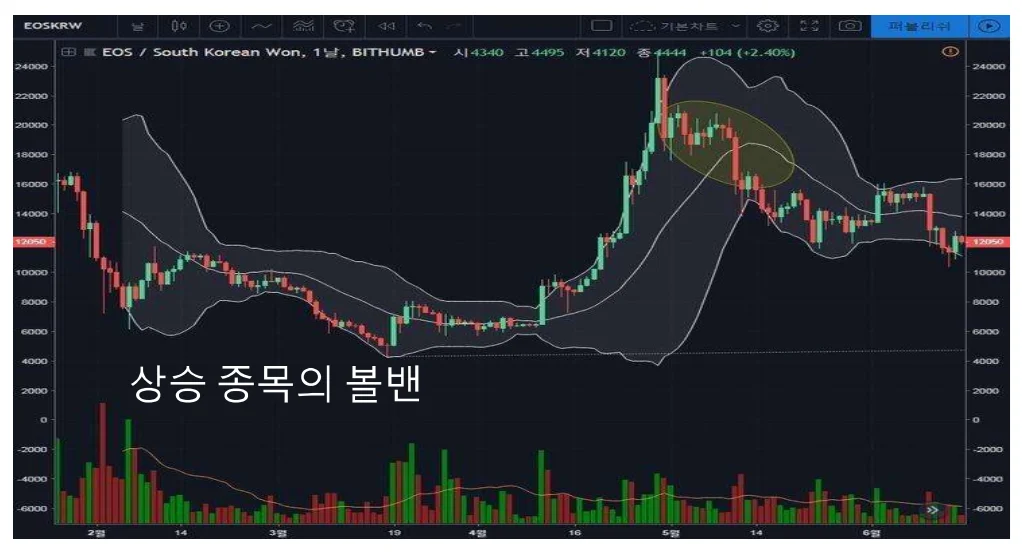
● Bollinger Bands for Rising Stocks
1.The rise can be divided into two cases: a sharp rise by opening the Bollinger Band and a rise while maintaining the closed Bollinger Band.
2.The photo above is a photo of a surge in EOS.
3.If you ride on the top of the ball van or soar while rubbing the top end, the ball van expands significantly.
4.It is necessary to observe whether it is riding the upper end of the ball van or which moving average it is riding on the rapid rise.
5.EOS soared on the 10-day line, the lifeline of soaring stocks. Stocks that have soared in this way will either move sideways or undergo a downward adjustment when the surge ends.
6.If it moves sideways, it will meet the center line of the ball ban and continue to rise again, or if the center line breaks, it will undergo a correction, so it is better to keep an eye on this and make a trade.
7.While moving sideways in the yellow circle area, you will meet the center line of the ball van.
8.If it fails to rise again here and the intermediate price breaks downward, this is a sell signal.
9.Since it has continued to rise while rubbing against the upper end of the ball van, if it breaks bellow the center line, it will inevitably fall bellow the ball van, so you need to sell. in the future, you can see that the 20th line has turned into a downward trend, tricking its head downwards.
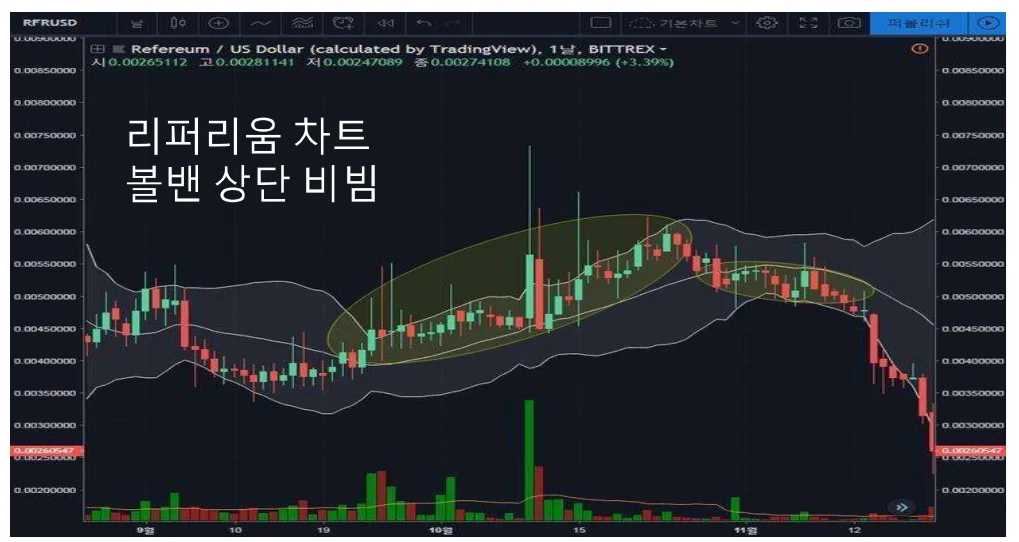
● Gentle Rise
1.The photo above is the Refereum chart. This is an example of a gradual rise along the center line of the Bollinger Band.
2.At this time, it rises along the middle line of the Bollinger Band and continues to rise until it deviates bellow the center line.
3.If the price deviates bellow the center line, it is a sell signal because it must be viewed downward.
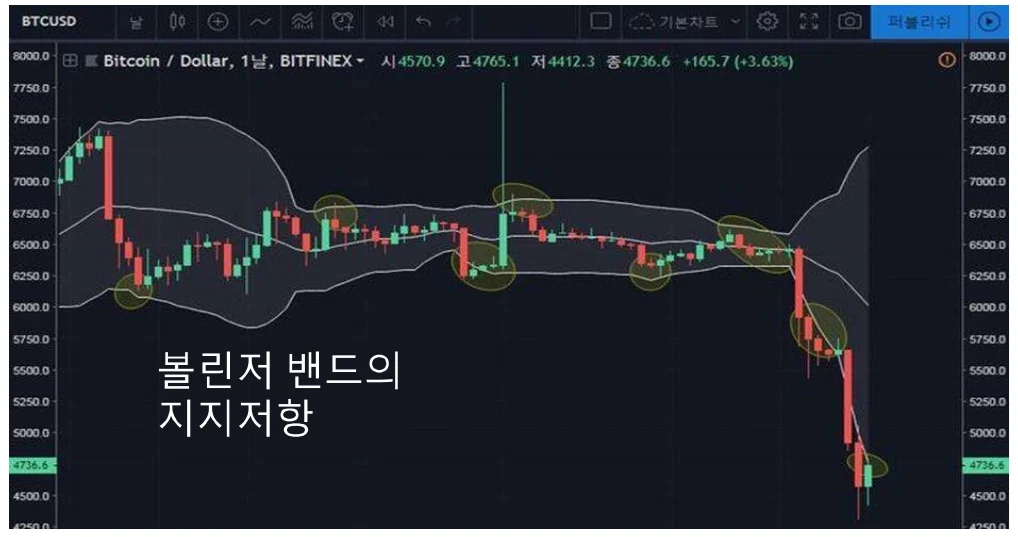
●Support and Resistance
1.The upper limit of the Bollinger band is known to act as support and resistance on its own.
2.Regardless of the top or bottom, Bollinger Bands act as resistance when the price approaches from below and support when the price approaches from above.
3.It also acts as support and resistance when the price moves outside the band and then tries to enter the band.
● Please look closely at the yellow circled part.