Uses of RSI 1
RSI Overbought and Oversold
1.Even though momentum is strong, it cannot always maintain that strength.
2.Therefore, if the upward momentum is too large, this is defined as overbought, and if the downward momentum is too large, this is defined as oversold. We must be overbought section and excessive depression in the oversold section.
3.In RSI, a value above 70 is uasually defined as an overbought zone, and a value below 30 is defined as an oversold zone.
4.If the RSI is in an overbought zone, you can be cautious as the market may be overheated, and if it is in an oversold zone, you can suspect that it is a recession zone.
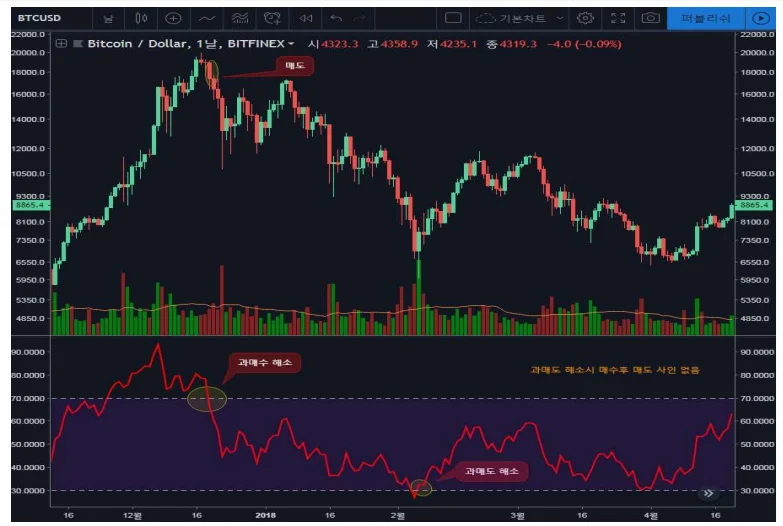
● RSI example bottom auxiliary indicator
1.In the photo, the indicator at the bottom of the chart is RSI. Under normal circumstances, the red-colored RSI rises when stock prices rise and falls when they fall.
2.This means that stock prices rise due to upward momentum and fall due to downward momentum.
3.Above the purple band, the RSI is above 70, which is an overbought zone, and below the band is below 30, which is an oversold zone.
● Uses of RSI
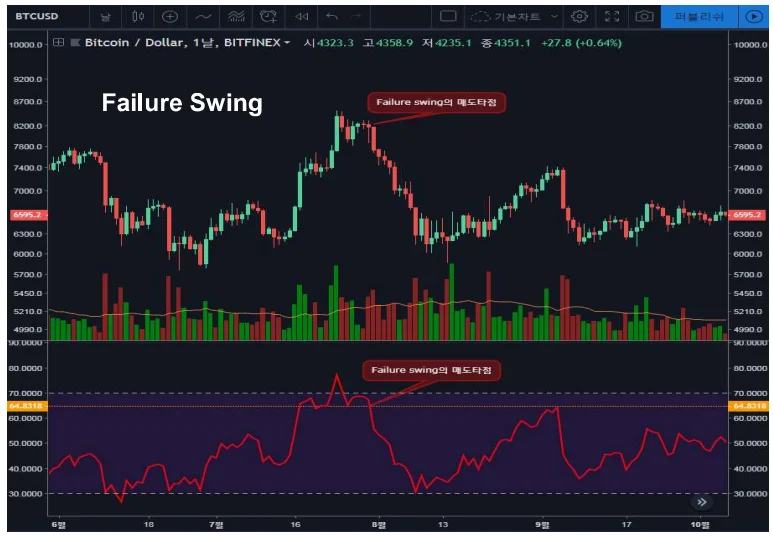
● Buy when pversold, sell when overbought?
1.In normal cases, in an overbought zone, you can sell stocks thinking that the excessive upward momentum will soon diminish and the stock price will fall, and in an oversold zone, you can buy stocks thinking that the excessive downward momentum will weaken in the future and the stock price will rise.
2.However, exceptionally strong momentum can be formed due to a specical issue or strong shooting.
3.In this case, you must be careful because the stock price may continue to rise even if it enters an overbought zone, and may continue to fall even if it enters and oversold zone.
4.Rather than using overbought and oversold as signals to sell or buy, a good strategy is to check the process of weakening momentum before trading.